Tax Expenditures Flying Under the Radar
Many of the tax breaks in the Federal tax code are classified as tax expenditures because, like many government spending programs, they subsidize particular economic activities or help particular groups of people. Tax expenditures contribute to the federal deficit, but don’t appear in the Federal budget and generally fly under the radar.
They're Huge
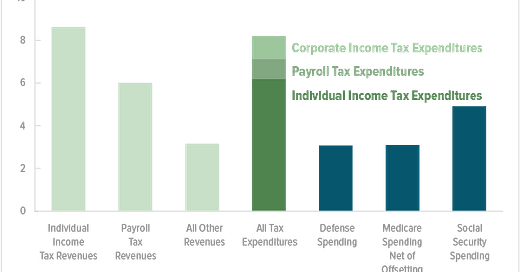
Although you rarely hear tax expenditures being discussed, they are huge: The Congressional Budget Office (CBO) expects 2017 tax expenditures to be 8% of GDP. This graph from the CBO shows just how big a deal they are by comparing them to other expenses and to sources of revenue:
You can see that tax expenditures dwarf defense spending, or Medicare spending, or Social Security spending. They are almost of the same magnitude as individual income tax revenues.
Tax expenditures are a big deal and worth understanding!
They're Complicated
Everything about tax expenditures is complicated. Even defining them precisely is complicated. Here's a relatively succint definition from Congress’ Joint Committee on Taxation in their 2017 report on estimates of tax expenditures:
Tax expenditures are defined under the Congressional Budget and Impoundment Control Act of 1974 (the “Budget Act”) as “revenue losses attributable to provisions of the Federal tax laws which allow a special exclusion, exemption, or deduction from gross income or which provide a special credit, a preferential rate of tax, or a deferral of tax liability.” Thus, tax expenditures include any reductions in income tax liabilities that result from special tax provisions or regulations that provide tax benefits to particular taxpayers.
Special income tax provisions are referred to as tax expenditures because they may be analogous to direct outlay programs and may be considered alternative means of accomplishing similar budget policy objectives. Tax expenditures are similar to direct spending programs that function as entitlements to those who meet the established statutory criteria.
The report goes on for 19 pages just discussing the concept of tax expenditures. And then it takes another 13 pages for a table that lists hundreds of individual and corporate tax expenditures and estimates their cost in lost revenue.
Remember that while “tax expenditures are similar to direct spending programs” they are not in the budget and are rarely discussed.
The Heavy Hitters
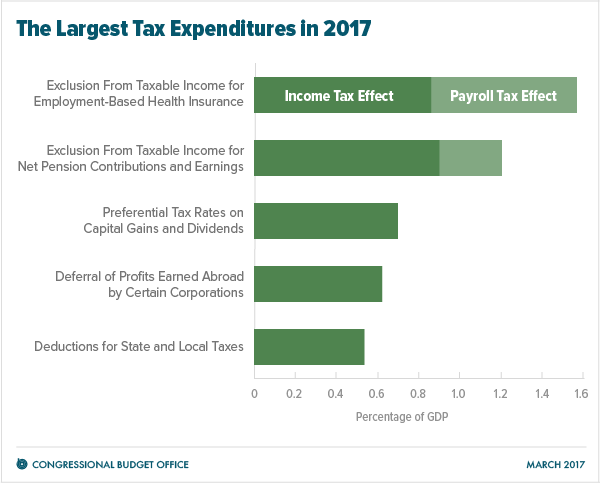
Discussing all of them would put you to sleep. (This is one of the big problems with the tax code's complexity — large subsidies can be given with little awareness.) Here are the heavy hitters, as reported by the Congressional Budget Office (CBO):
I’m going to narrow down further, looking at the three biggest using detailed data from a 2013 CBO report:
Exclusion of employer-sponsored health insurance: More than 150 million people are covered by employer-subsidized health insurance. Employer-paid premiums for this insurance are not taxed as income to the employee. This exclusion reduces Federal tax revenues by $248 billion compared with what tax revenue would have been if the employee had been paid the equivalent amount and used after-tax money to purchase insurance.
Preferential tax rates on capital gains and dividends: Income earned from long-term capital gains (e.g., stock held for more than a year) and from most dividends received from stocks is taxed at a lower rate than ordinary income (e.g., wages). These preferential tax rates reduce Federal tax revenues by $161 billion.
Exclusion of net pension contributions and earnings: All money invested by employers and most money invested by employees in various kinds of pension and retirement plans (including IRAs and 401Ks) is not taxed until the money is withdrawn during retirement. Likewise, investment earnings in such plans are not taxed when earned but only when withdrawn (or not at all). Delaying taxes on this money reduces tax revenues by $137 billion.
Since most state income taxes are based on Federal definitions, states, too, lose a lot of revenue from these tax breaks.
The Trump tax code changes that went into effect in 2018 don’t significantly affect these three tax breaks. The Trump changes will reduce the next largest tax expenditures — deductions for state and local taxes ($77 billion) and home mortgage interest ($70 billion).
Who Benefits From Tax Expenditures?
Four of the five largest tax expenditures affect individuals. In 2013, the Congressional Budget Office (CBO) published an extensive analysis of the 10 largest tax expenditures in the individual tax system. This report analyzed the size of each tax expenditure and to whom the benefit of the tax break accrues.
The CBO divided households into quintiles based on household incomes, and each quintile contains the same number of people. The graph below, taken from the report, shows the distribution of the benefits across the quintiles:
More than half of the benefit of the top 10 tax expenditures in the individual tax system accrues to people in the top 20% of household incomes. In fact, 17% of the benefit accrues to people in just the the top 1% of household incomes.
At the other end of the income spectrum, only 8% of the benefit accrues to people in the bottom quintile. You might wonder how the lowest-income households get any benefit at all from tax expenditures given that they earn so little money. The answer is that the CBO’s analysis includes the earned income and child tax credits, which are both refundable and income limited (see my previous post on tax credits).
So, the bottom line is that the highest earners among us get, by far, the largest part of the benefit of tax expenditures.
This is particularly true of the preferential treatment of capital gains and dividends: 93% of the benefit goes to the top quintile, with 68% going to the top 1%!
The CBO also analyzed what portion of a household’s after-tax income derives from tax expenditures, as shown in this graph from the report:
Interestingly, the benefit of the tax expenditures has the biggest impact on the after-tax income of people in the bottom quintile and also of people in the top quintile, but especially those in the top 1% of household income.
So What?
Many politicians tell us that we can’t afford social safety net programs like Medicare, Medicaid, and Social Security. Meanwhile, we spend way more than any of these programs on tax breaks that benefit primarily the highest earners among us. Yet, tax expenditures rarely figure in the political debate despite their size and impact.
Tax expenditures fly under the radar because few people are aware of them and when they are discussed they are framed as tax cuts.
Can you imagine a politician going on TV and saying “Let’s pay high-earners $150 billion annually to encourage them to buy stock”? Of course not, but that’s what preferential treatment of capital gains and dividends really is.
And if you want to argue that these are only tax reductions, not spending, you’re missing the whole picture. The Federal budget is about $4 trillion. If we lower taxes on capital gains for high earners by $150 billion, either we’re raising taxes on someone else to compensate or we’re adding to the deficit. It is exactly the same as if we made this payment directly to stock investors — it would have to come from somewhere.
Can’t Afford to Help Poor People
Some politicians rail against subsidizing health care for poor people, yet ignore the almost $150 billion we spend subsidizing health care for people in the top two quintiles (60% of the exclusion of employer-sponsored health insurance accrues to the top two quintiles).
Some politicians advocate cutting “welfare” both because they say it is too expensive and makes people “dependent”. But look at the numbers. The two major Federal welfare programs are Temporary Assistance to Needy Families (TANF) and the Supplemental Nutritional Assistance Program (SNAP). The Federal government spent $20 billion on TANF and $76 billion on SNAP (2015 data).
Let’s compare this $96 billion “welfare” expenditure with the the tax expenditure benefits that flow to people in the highest quintile of household earnings. The CBO report identifies $926 billion in tax expenditures, of which 51% accrues to people in the highest quintile. So, we give $472 billion in tax breaks to help the highest earners among us, compared with spending $96 billion on welfare.
What Next?
This post completes the background information that I wanted to get across about our tax system. Next, I will start writing about what I think true tax reform — rather than the sham Trump tax reform — would look like. Please stay tuned. (You can sign up to receive these posts by email.)


